Curriculum
Climate Justice and Action
Module 2
0/1Understanding Climate Change and Climate Justice
Module 1
Learning Objectives
By the end of this module, learners should be able to:
-
Explain the science of climate change and differentiate it from climate variability.
-
Identify the major global and regional drivers of climate change.
-
Describe the concept of climate justice and why it is central to global and African climate action.
-
Discuss how climate change disproportionately affects marginalised groups, including women and youth.
Section 1: The Science of Climate Change
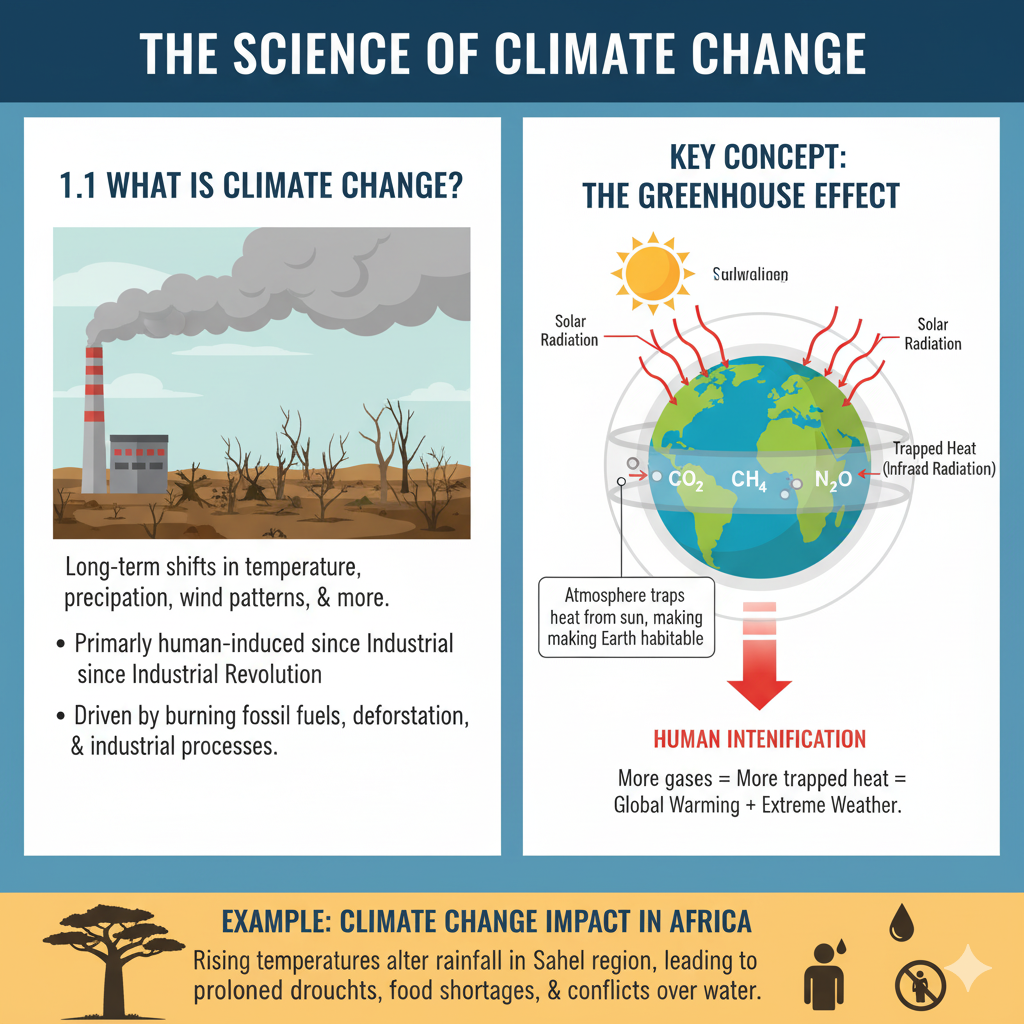
1.1 What Is Climate Change?
Climate change refers to long-term shifts in temperature, precipitation, wind patterns, and other aspects of the Earth’s climate system. While natural factors (such as volcanic eruptions and solar variations) influence climate patterns, the rapid changes observed since the Industrial Revolution are primarily human-induced, driven by the burning of fossil fuels, deforestation, and industrial processes.
Key concept:
-
The Earth’s atmosphere contains gases — carbon dioxide (CO₂), methane (CH₄), nitrous oxide (N₂O), and water vapour — that trap heat from the sun.
-
This natural process, known as the greenhouse effect, makes the Earth habitable.
-
However, human activities have intensified this effect, leading to global warming and extreme weather events.
Example (Africa):
Rising global temperatures have altered rainfall patterns in the Sahel region, contributing to prolonged droughts, food shortages, and conflicts over scarce water resources.
1.2 Global Greenhouse Gas Emissions
Top global emitters:
China, the United States, the European Union, India, and Russia account for over 60% of global CO₂ emissions.
Africa contributes less than 4%, yet bears the brunt of its impacts — making this a justice issue, not just an environmental one.
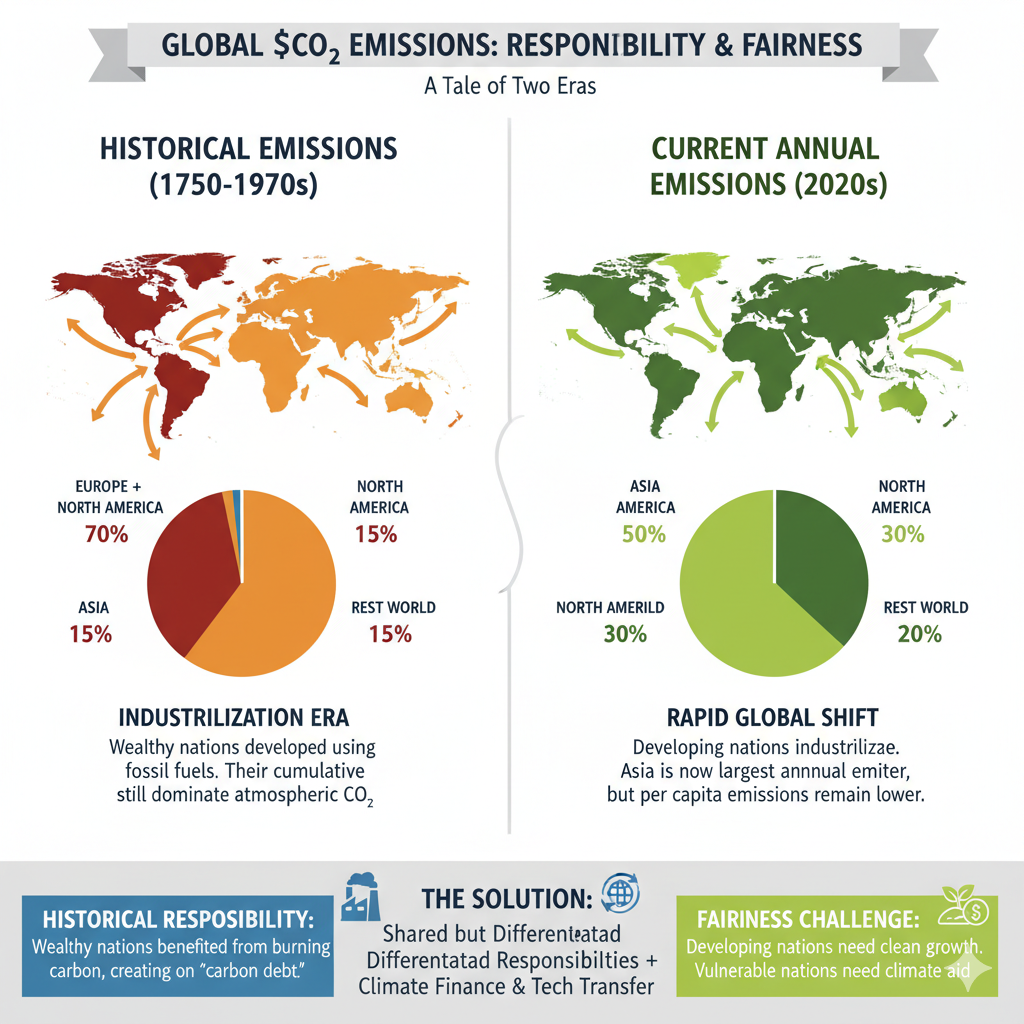
An analysis of historical and current CO₂ emissions by continent highlights significant disparities that underpin global debates over responsibility and fairness in climate change mitigation.
Key Observations on CO₂Emissions
While specific maps will show detailed figures, general trends consistently reveal the following:
-
Historical Emissions (Cumulative): The vast majority of historical cumulative CO₂ emissions (since the Industrial Revolution) originated in North America and Europe (including the European Union and the UK). These continents were the first to industrialise, relying heavily on fossil fuels for their economic development and rise to wealth.
-
Current Emissions (Annual): In recent decades, the pattern has shifted. Asia (particularly China and, increasingly, India) is now the largest annual emitter, driven by rapid industrialisation, large populations, and a growing middle class. North America and Europe’s share of annual emissions has generally decreased or stabilised (though still high).
-
Per Capita Emissions: A crucial metric, per capita emissions often show that high-income nations in North America and Oceania (like the US, Canada, and Australia) and parts of Europe have significantly higher emissions per person than most nations in Africa and South Asia, despite Asia’s high total emissions.
-
Low Emissions: Africa and South America historically and currently account for a comparatively small fraction of global cumulative and annual CO₂emissions, despite having large or growing populations.
Reflection: Responsibility and Fairness
These emission patterns tell a powerful story about who caused the problem and who is currently bearing the burden of the solution, raising complex questions of justice and equity.
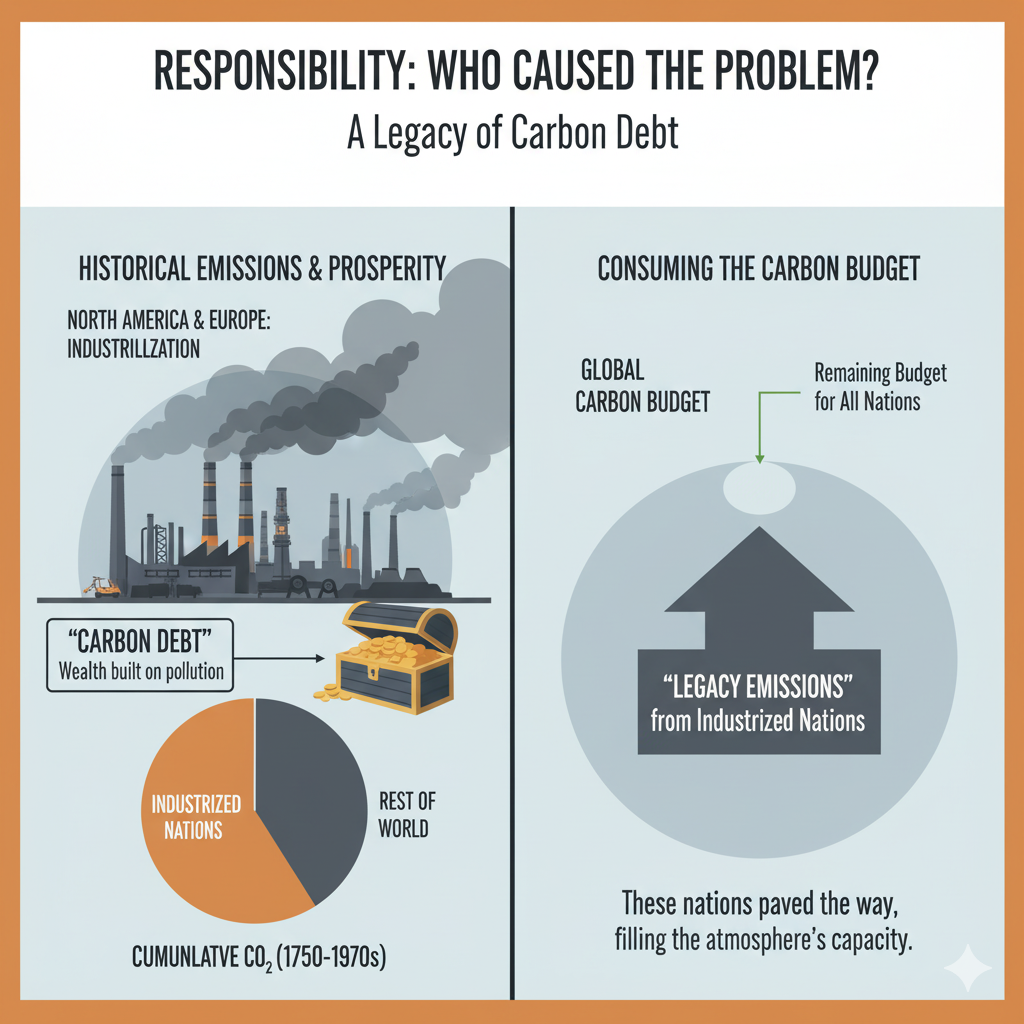
Responsibility: Who Caused the Problem?
The map clearly indicates that industrialised nations in North America and Europe bear the greatest historical responsibility for the atmospheric concentration of greenhouse gases.
-
“Legacy Emissions”: The CO₂currently causing climate change often remains in the atmosphere for centuries. The high cumulative emissions of historically industrialised regions mean that the prosperity of these nations was built upon the unpriced externality of carbon pollution. This is often framed as their “carbon debt.”
-
Paving the Way: These nations essentially consumed the bulk of the atmosphere’s “carbon budget”—the maximum amount of CO₂that can be released while staying within relatively safe temperature limits.
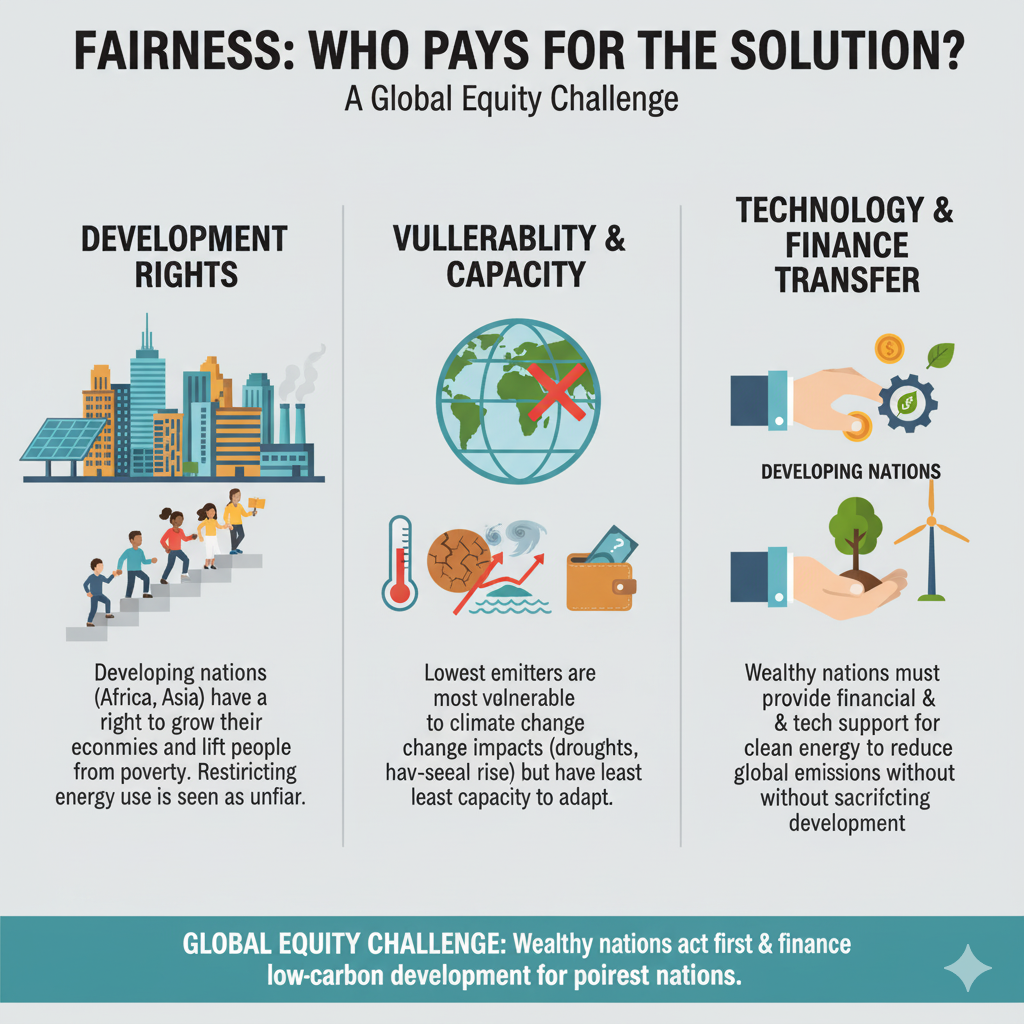
Fairness: Who Pays for the Solution?
The current and historical emission data fuel the core debate about “Common But Differentiated Responsibilities and Respective Capabilities” (CBDR-RC)—a principle enshrined in international climate agreements.
-
Development Rights: Developing nations, particularly in Africa and Asia, argue that they have a right to develop their economies and lift their populations out of poverty, a process that historically has been energy-intensive. They contend that restricting their energy use now to fix a problem primarily caused by industrialised nations is inherently unfair.
-
Vulnerability and Capacity: Many of the continents and countries with the lowest emissions (e.g., Africa, small island states) are the most vulnerable to the physical impacts of climate change (droughts, sea-level rise, extreme weather) and have the least financial capacity to adapt. This disparity represents a profound climate injustice.
-
Technology and Finance Transfer: A cornerstone of the fairness argument is that historically responsible, wealthy nations should provide substantial financial and technological support to developing countries. This aid would allow developing nations to leapfrog the fossil-fuel-intensive stage of development and adopt clean energy solutions, thereby reducing future global emissions without sacrificing development goals.
In essence, the CO₂ map serves as a visualisation of a global equity challenge: the wealthiest nations (with the highest historical and per capita emissions) must take the most aggressive and immediate action, while also financing the low-carbon and resilient development of the poorest nations (with the lowest historical emissions).
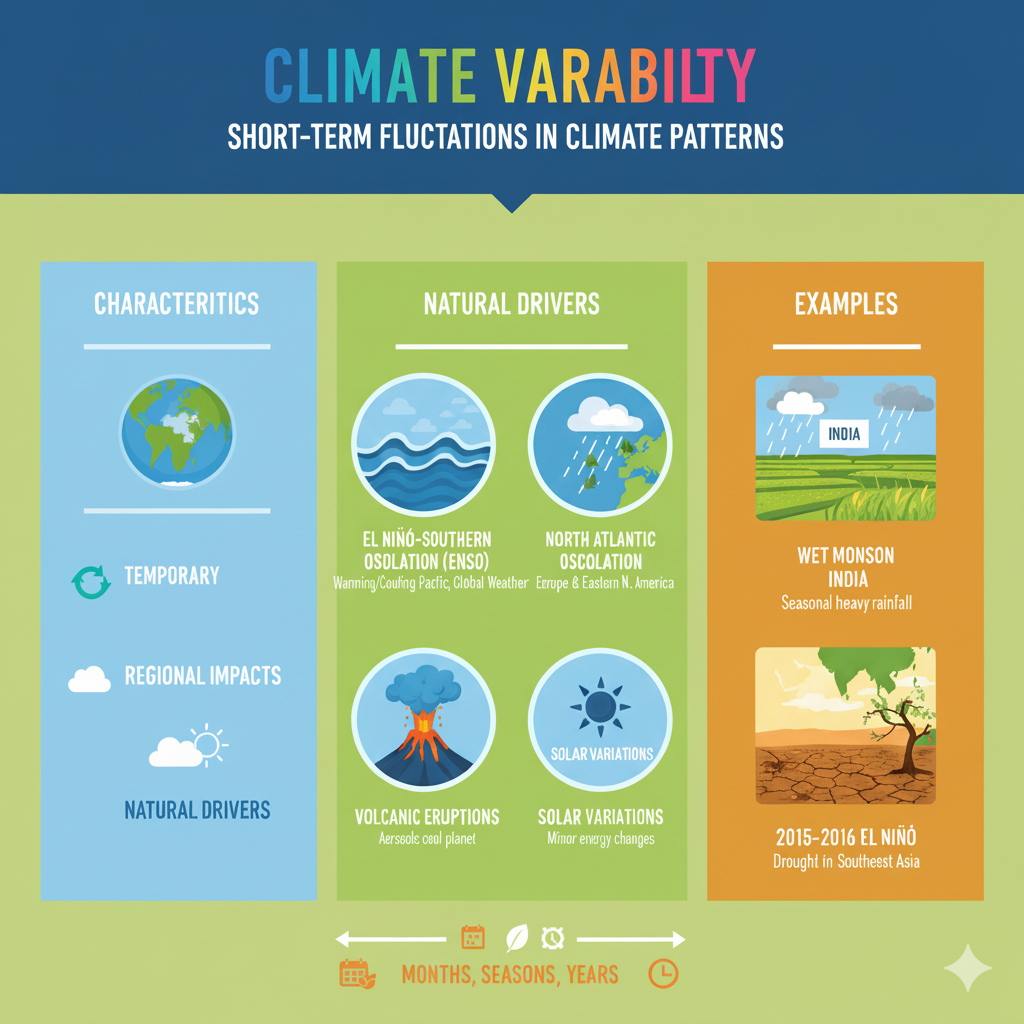
1.3 Climate Variability vs. Climate Change
Climate variability refers to short-term fluctuations in climate patterns. These are natural deviations from the average climate conditions that occur over months, seasons, or a few years. They are driven by natural internal processes within the Earth’s climate system, such as ocean currents and atmospheric circulation.
-
Characteristics:
-
Temporary: These shifts are not permanent and usually revert to mean conditions.
-
Regional Impacts: Often have pronounced regional effects.
-
Natural Drivers: Primarily caused by natural phenomena like:
-
El Niño-Southern Oscillation (ENSO): A periodic warming (El Niño) or cooling (La Niña) of ocean surface temperatures in the equatorial Pacific, which significantly impacts weather patterns globally, causing droughts in some regions and heavy rainfall in others.
-
North Atlantic Oscillation (NAO): Affects weather across Europe and eastern North America.
-
Volcanic Eruptions: Can temporarily cool the planet by injecting aerosols into the stratosphere, reflecting sunlight.
-
Solar Variations: Minor changes in the sun’s energy output can influence Earth’s climate.
-
Example: A particularly wet monsoon season in India or a colder-than-average winter in a specific region of Europe might be examples of climate variability. The El Niño event that caused widespread drought in parts of Southeast Asia in 2015-2016 is a classic example of climate variability.
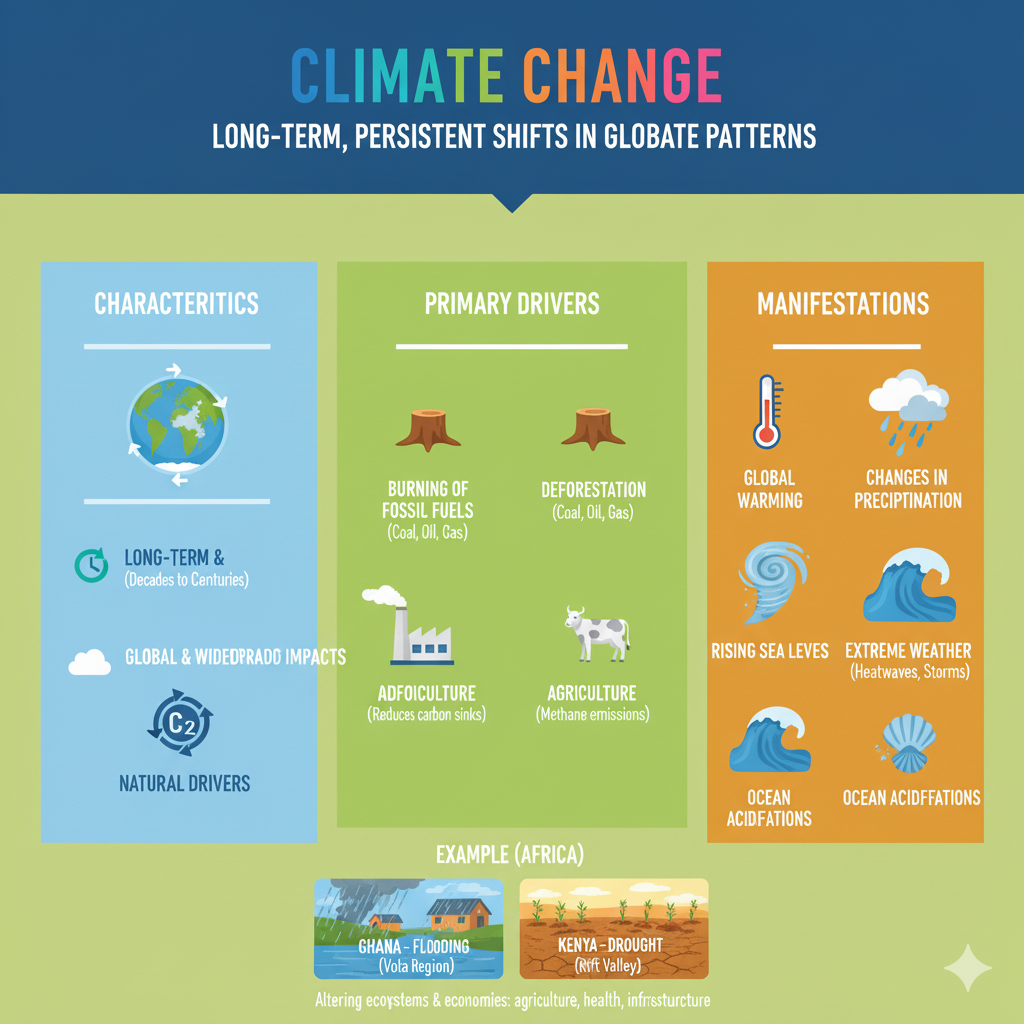
Climate change, on the other hand, refers to long-term, persistent shifts in global or regional climate patterns. These changes represent a new, altered average state for the climate system, not just a temporary fluctuation around an existing average. The current era of rapid climate change is overwhelmingly human-induced.
-
Characteristics:
-
Long-term & Persistent: Involve sustained changes over decades to centuries.
-
Global & Widespread Impacts: Affect the entire planet, though manifestations differ regionally.
-
Primary Driver: Human Activities: Since the Industrial Revolution, the primary driver has been the increased concentration of greenhouse gases in the atmosphere due to:
-
Burning of fossil fuels (coal, oil, natural gas)
-
Deforestation (reducing natural carbon sinks)
-
Industrial processes and agriculture
-
Manifestations: Leading to:
-
Global warming (rising average temperatures)
-
Changes in precipitation patterns (more intense rainfall, prolonged droughts)
-
Rising sea levels
-
Increased frequency and intensity of extreme weather events (heatwaves, storms)
-
Ocean acidification
-
Example (Africa): The persistent and increasingly severe flooding in Ghana’s Volta region or the more frequent and prolonged droughts in Kenya’s Rift Valley are no longer seen as isolated incidents of variability. Instead, they are becoming part of a changing climate pattern. This shift is fundamentally altering ecosystems and economies, affecting critical sectors like agriculture (crop failures, livestock loss), health (waterborne diseases, malnutrition), and infrastructure (damaged roads, homes). These are not just bad years; they represent a fundamental alteration of the region’s climatic baseline.
Key Insight
In summary, think of it this way:
Climate variability is like the daily ups and downs of a stock market, while climate change is the long-term trend of that market rising or falling over many years. While natural variability always exists, climate change refers to the shift in the underlying average conditions to which natural variability is now superimposed.